
Sankey Diagram | Chart
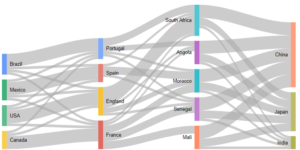
Overview: A Sankey diagram is a type of flow diagram that is used to visualize the flow of energy, materials, or other quantities between different nodes. The nodes are represented …
Overview: A Sankey diagram is a type of flow diagram that is used to visualize the flow of energy, materials, or other quantities between different nodes. The nodes are represented …